Geological and geophysical data measured, collected by the Survey and its legal predecessors are accessible and can also be used by external experts. Most of them are organized in database, provided with metadata and available in a browsable form. Data on level of exploration are accessible in a separate database on the website of the Survey or can be studied submitted on demand. The most frequently required data systems are introduced as follows.
Seismic database
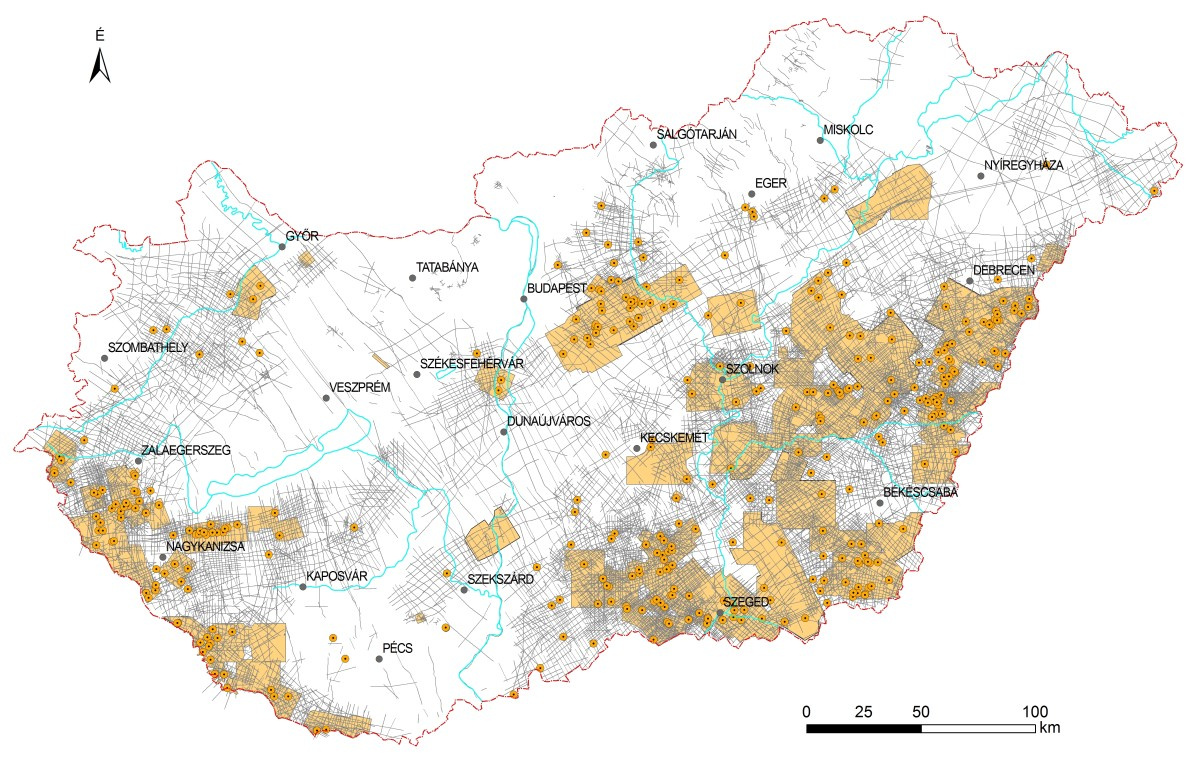
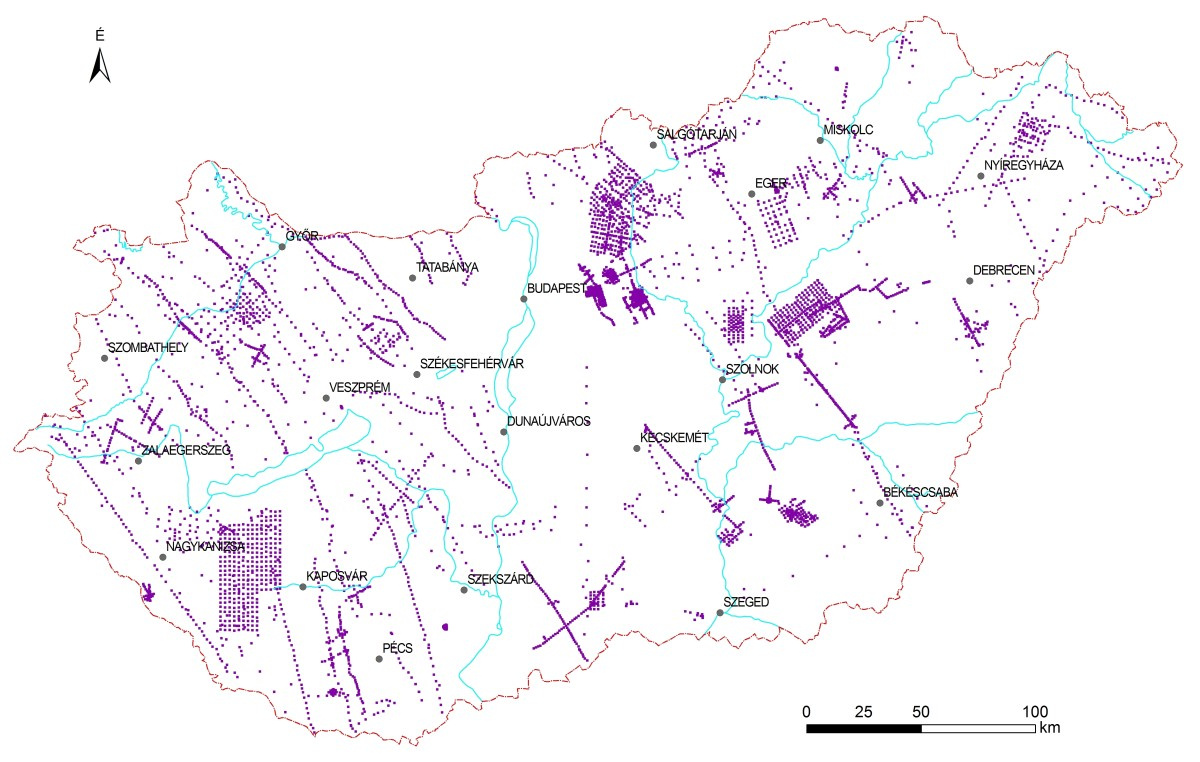
The database contains field and processed data of seismic 2D and 3D measurements performed in Hungary, irrespective of the performer and the goal of measurement. Most of the 2D measurements were performed for general exploration purposes by the Loránd Eötvös Geophysical Institute of Hungary (ELGI), later on by ELGI and market players with intention to exploration for mineral resources, mainly hydrocarbon exploration. 3D measurements were performed mainly for exploration for hydrocarbons, totalling approx. 20% coverage of the country by the end of 2017. Seismic materials are mainly accessible in field detection and processed, migrated form.
Number of objects:
- 3D block, processed: 98 pcs,
- 3D block, field measurement: 107 pcs,
- 2D line: 6,577 pcs,
- 2D processed line, in SEGY format: approx. 3,200 pcs.
Data format: SEGY, SEGD. The level of upload of database is approx. 85%. Coverage: countrywide, rare in mountainous areas (Figure 2). Preparedness: 1 December 2017. Source: the measurements of ELGI; obligatory data delivery to the Hungarian Office for Mining and Geology (MBFH) and MBFSZ; MOL Plc. and its legal predecessors. Updating: annually.
Deep borehole geophyisical database
The first cross-sectioning was carried out in Hungary in 1935 by Schlumberger Company, and essentially well-loggings have been performed in Hungary since the 1950s. Lately, the development followed world-class level left behind by 10 years, so computerized data processing was about to begin approx. at the end of the 1970s, digital field data recording was spread in the 1980s. The number of informative objects relevant for hydrocarbon exploration: approx. 7,200 of which 1,700 are digital. Data format: las file. Coverage: countrywide (Figure 3). Source: the measurements of ELGI; obligatory data delivery to the Hungarian Office for Mining and Geology (MBFH) and MBFSZ; MOL Plc. and its legal predecessors. Updating: annually.
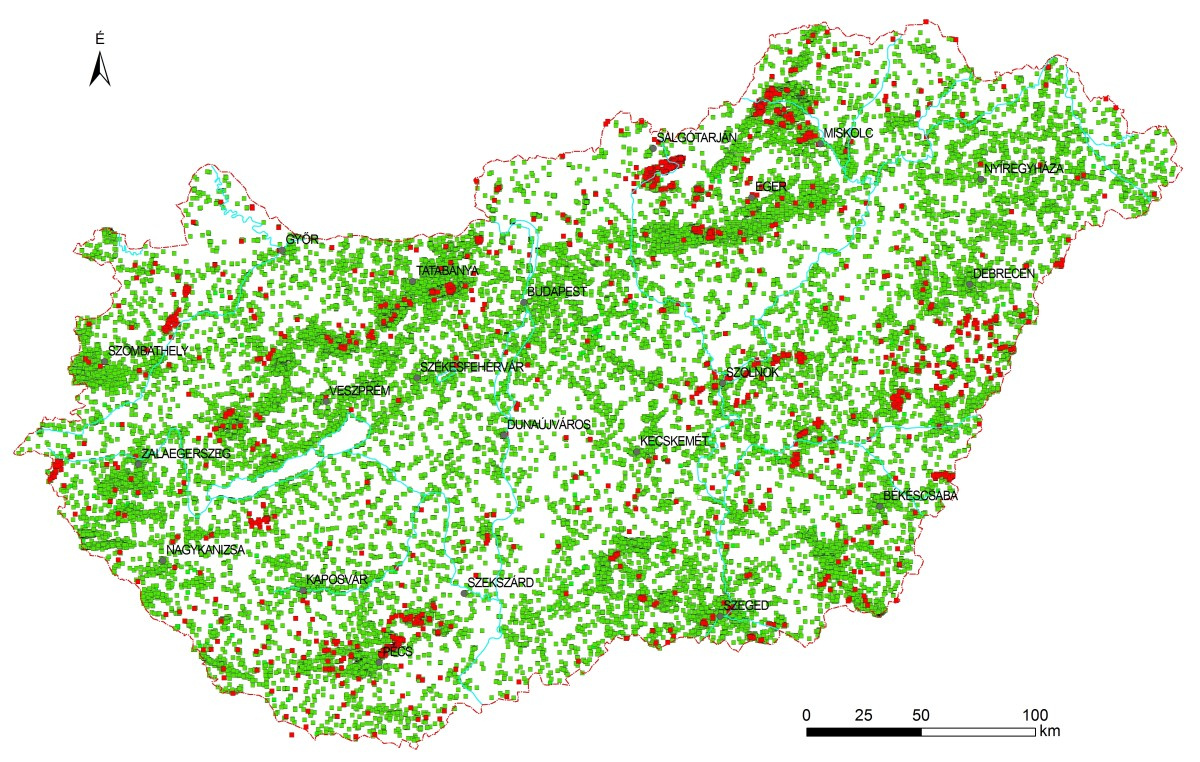
Gravity databases
The database contains data of gravimetric measurements performed on the ground (acceleration, width correction, height correction, Bouguer plate correction, value of topographical close and distant effect).
The overview measurements along passable roads, covering the whole country consistently, have been performed by ELGI, the most of the concentrated measurements by ELGI and sector players on industrial orders. Measurement data are from period between 1950 and 2007. The average available punctuality of measurements is 0.1 mGal.
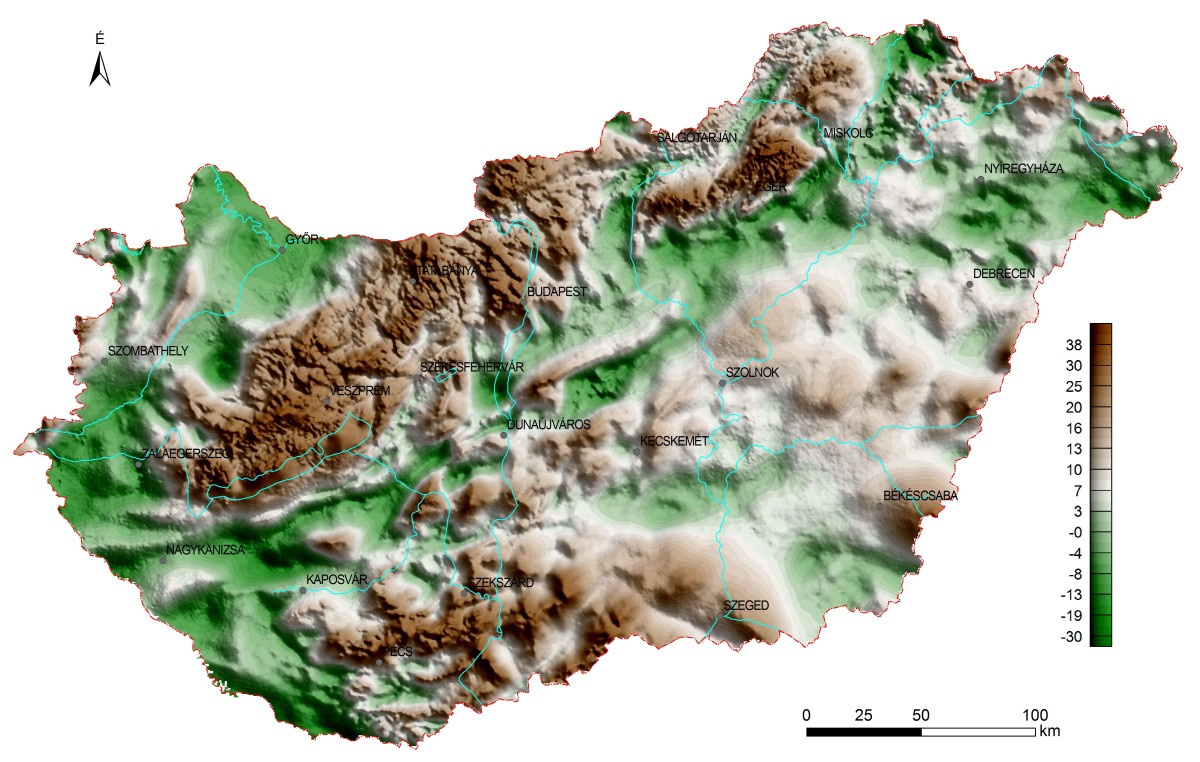
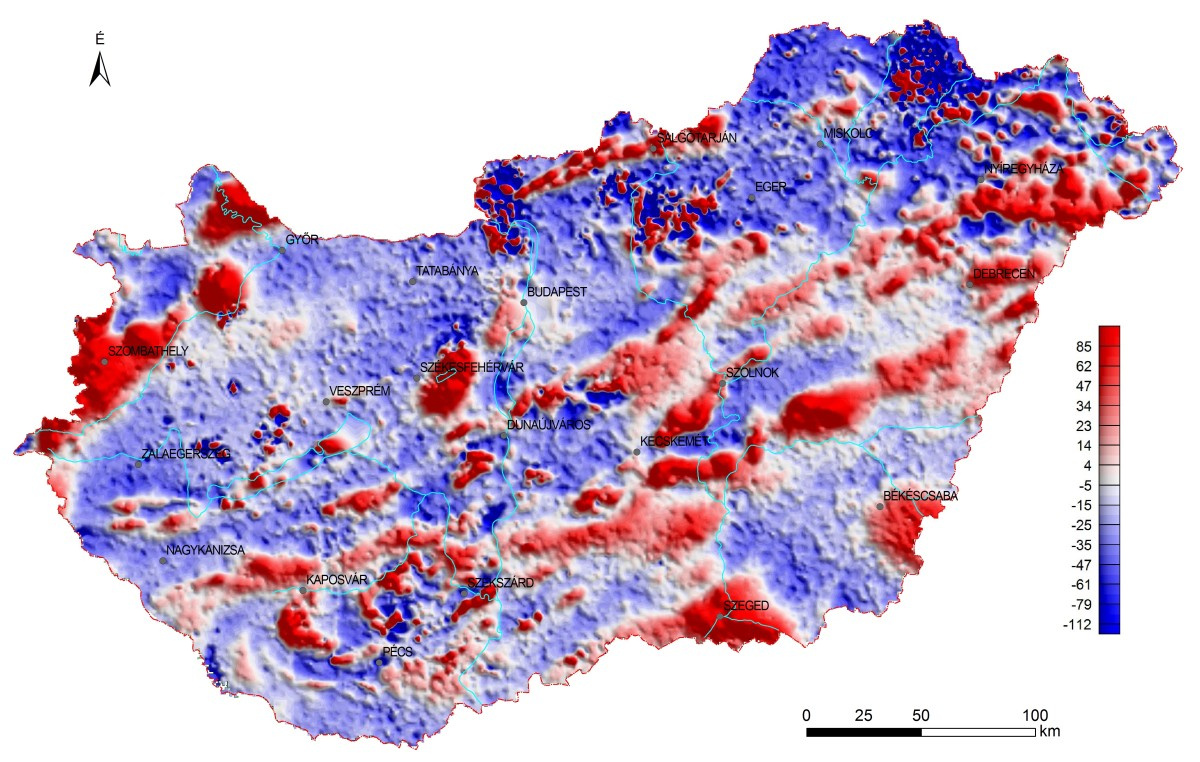
The average level of survey: in case of overview measurements approx. 2.8 spots/km2, as for concentrated measurements 6 spots/km2. Based on the data system, a parameter map can be composed of any area of the country (Figure 4). Format: ASCII. Level of upload: 99%. Coverage: countrywide, the area of Hungary (Figure 5). Preparedness: 1 January 2017. Source: the measurements of ELGI; obligatory data delivery to the Hungarian Office for Mining and Geology (MBFH) and MBFSZ; MOL Plc. and its legal predecessors. Updating: in every 6 month.
Magnetic database
The database contains magnetic detected data on ground and corrected (gone through normal space correction, unified) magnetic ΔZ and ΔT data. ΔZ measurements consistently covering the whole country were performed by ELGI, most of the concentrating ΔT measurements by industrial players for hydrocarbon exploration. Measurement data are from period between 1949 and 2004. The resolution of data system is 0.1 nT. General level of survey: ΔZ ~ 0.8 points/km2, ΔT 6 points/km2. Based on the data system, a parameter map can be composed of any area of the country (Figure 6). Number of stored objects: ΔZ – 76,705 pcs; ΔT – 137,817 pcs. Preparedness: 1 January 2017. Updating: annually.
Magnetotelluric data
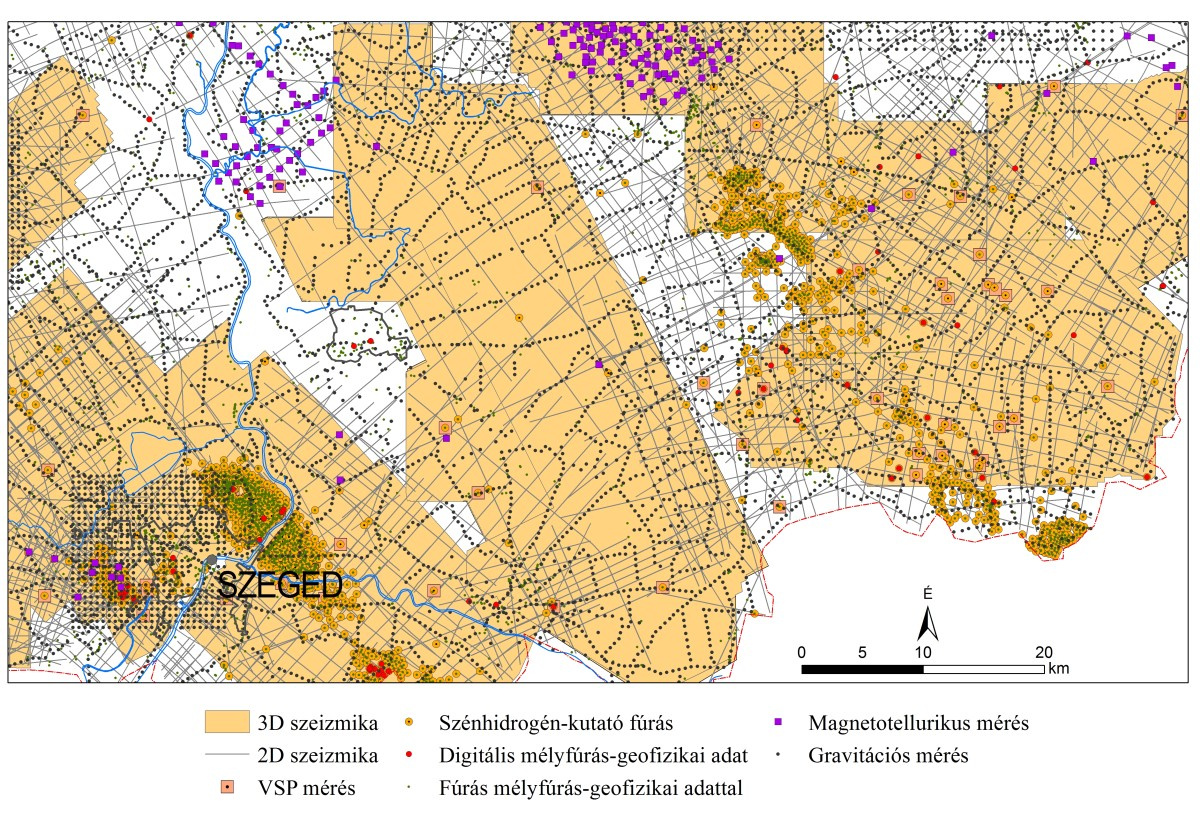
The National Magnetotelluric Data System has information on magnetotelluric measurement points measured by ELGI ¬– MFGI, MOL Hungarian Oil Company and MTA (Hungarian Academy of Sciences). The current 5,021 items contain items of magnetotelluric tensors obtained by the processing of 4,068 magnetotelluric time series, mainly in text files generally accepted in standard EDI format (WIGHT 1988). Measurement time series have been in the database since 2015. Based on soundings, material and structural homogeneity of great depths is explorable. The number of stored objects: 5,021 pcs. Format: EDI. Level of upload: 99%. Coverage: countrywide, the area of Hungary (Figure 8). Preparedness: 1 December, 2017. Updating: annually.
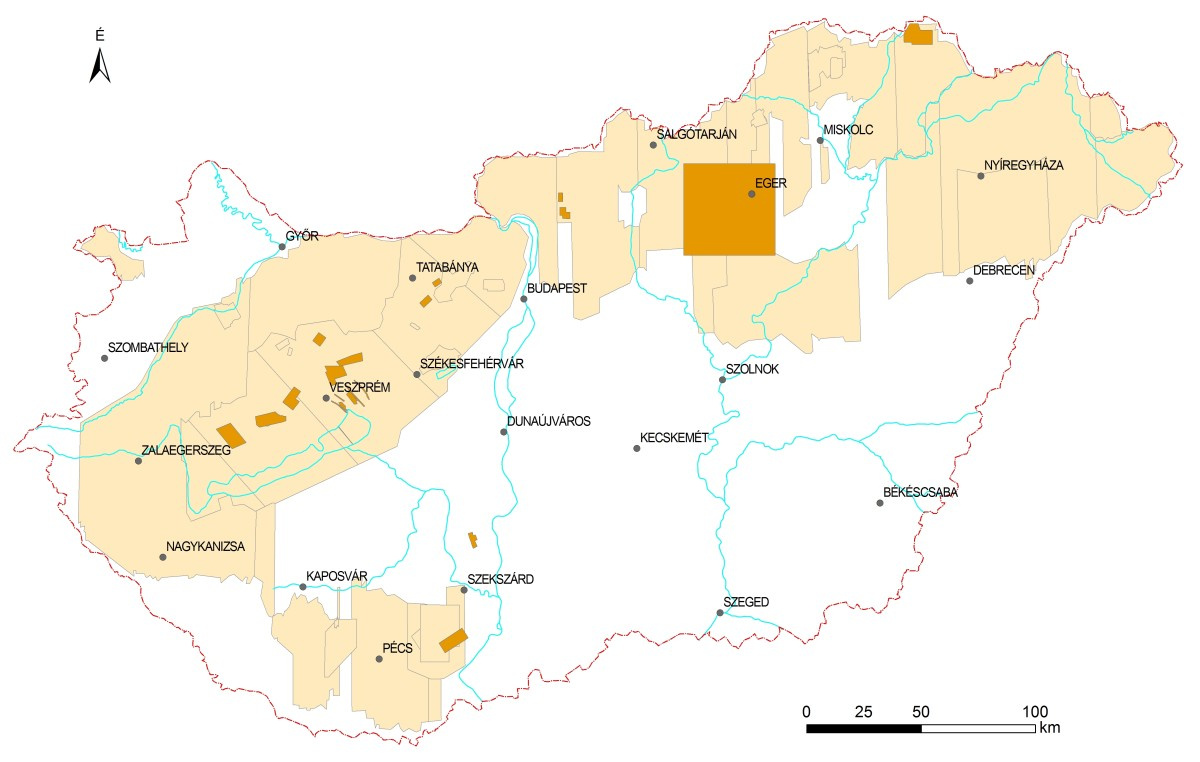
Aerial geophysical database
The database contains available aerial geophysical data of Hungary for period 1967-2005. Approx. 40% of the country’s area was surveyed between 1967-1969, mainly by the Sowiet Union, for uranium exploration purposes and typically with cross-sections in every 500 m. Such measurements resulted in magnetic and radiometric data, ensuring higher data density as compared to measurements on the ground. After 1989, more modern, digitally recorded measurements containing electromagnetic channels as well were carried out locally. On one hand, the database contains magnetic ∆T measurements and radiometric (potassium /K/, equivalent uranium /eU/, equivalent thorium /eTh/ and total gamma intensity /TC/) together called as ‘Russian measurements’ (at different levels of processing), on the other hand, digitally recorded measurements containing – above the above mentioned – VLF and electromagnetic (EM) parameters carried out in 2-3 frequencies as well. Density of former data is further one scale higher. Such data are for sub-areas only (Figure 9, with brown colour). Number of stored objects: 657,662 magnetic ∆T grid points. Level of upload: 75%. Coverage: regional. Aerial radiometric and aerial magnetic data measured between 1967-1969 are available for approx. 40% of the country’s area. There are sets in higher resolution locally (Figure 9). Preparedness: according to 1 January 2017. Source: measurements of ELGI and MÉV (former Mecsek Ore Mining Company, today: Mecsekérc Plc.); obligatory data delivery to MBFH and MBFSZ.